How Stable Are Thematic Hivemind Exposures?
A common question we are asked is how stable are thematic Hivemind exposures?
The answer, of course, depends on how our customizable exposure pipeline is tuned. For this article, we'll restrict the pipeline to annual data inputs only, and analyze changes year over year for an R3 proxy universe. We'll do so for 3 thematic exposures since 2023:
- AI and GenAI
- Inflation
- US Tariffs
Table of Contents:
- Exposure Stability: AI and GenAI
- Exposure Stability: Inflation
- Exposure Stability: US Tariffs
- Takeaways
1. Exposure Stability: AI and GenAI
AI and GenAI has been a remarkably stable thematic Hivemind exposure over the last 3 years. Not a single value from our select large cap universe below changed, and few exposures changed from negative to positive, or vice versa, year over year.
Select Large Cap Exposures - AI and GenAI:
| Ticker | 2023 | 2024 | 2025 |
|---|---|---|---|
| XOM | 0 | 0 | 0 |
| TSLA | 1 | 1 | 1 |
| PLTR | 1 | 1 | 1 |
| NVDA | 2 | 2 | 2 |
| MSFT | 2 | 2 | 2 |
| AMZN | 1 | 1 | 1 |
| AAPL | 1 | 1 | 1 |
| WMT | 0 | 0 | 0 |
| HD | 0 | 0 | 0 |
| LLY | 0 | 0 | 0 |
| JPM | 0 | 0 | 0 |
| BA | 0 | 0 | 0 |
Exposure Transition Matrices - AI and GenAI:
2023 -> 2024 (counts and row %):
| -2 | -1 | 0 | 1 | 2 | |
|---|---|---|---|---|---|
| -2 | 0 (0.0%) | 2 (100.0%) | 0 (0.0%) | 0 (0.0%) | 0 (0.0%) |
| -1 | 1 (2.9%) | 22 (64.7%) | 8 (23.5%) | 3 (8.8%) | 0 (0.0%) |
| 0 | 0 (0.0%) | 7 (0.4%) | 1836 (93.6%) | 119 (6.1%) | 0 (0.0%) |
| 1 | 0 (0.0%) | 2 (0.4%) | 103 (19.3%) | 406 (76.2%) | 22 (4.1%) |
| 2 | 0 (0.0%) | 0 (0.0%) | 0 (0.0%) | 11 (20.4%) | 43 (79.6%) |
2024 -> 2025 (counts and row %):
| -2 | -1 | 0 | 1 | 2 | |
|---|---|---|---|---|---|
| -2 | 1 (100.0%) | 0 (0.0%) | 0 (0.0%) | 0 (0.0%) | 0 (0.0%) |
| -1 | 1 (3.3%) | 21 (70.0%) | 7 (23.3%) | 1 (3.3%) | 0 (0.0%) |
| 0 | 0 (0.0%) | 1 (0.1%) | 1723 (93.0%) | 129 (7.0%) | 0 (0.0%) |
| 1 | 0 (0.0%) | 4 (0.8%) | 103 (20.8%) | 371 (74.8%) | 18 (3.6%) |
| 2 | 0 (0.0%) | 0 (0.0%) | 0 (0.0%) | 12 (20.0%) | 48 (80.0%) |
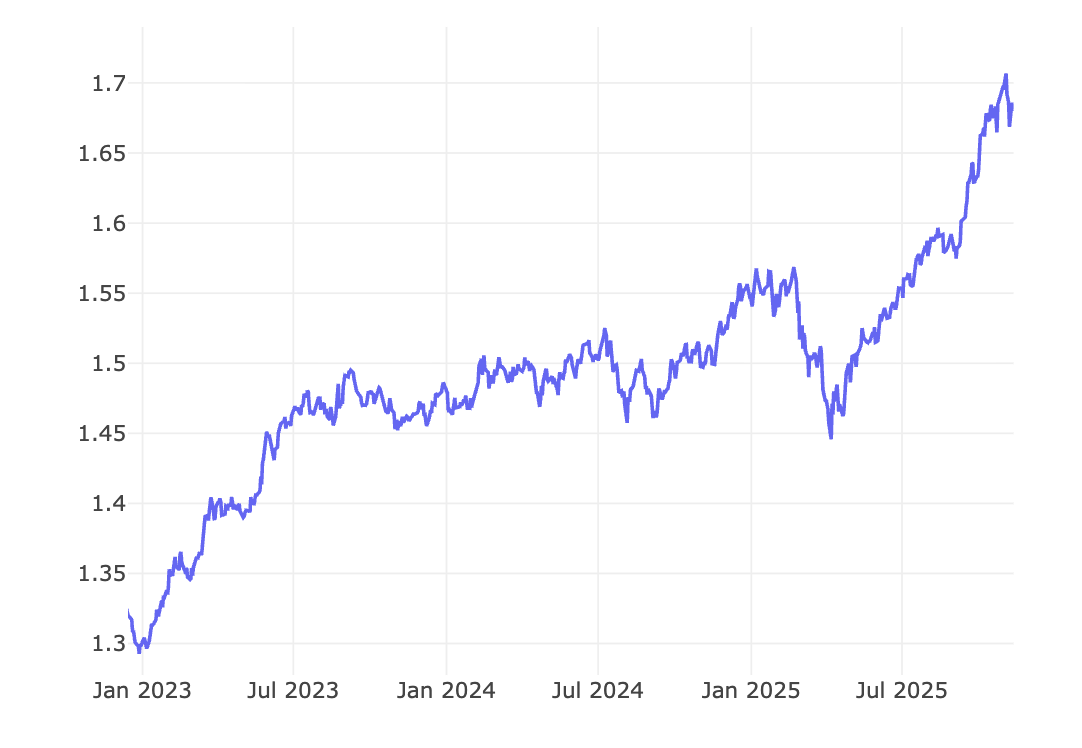
Exposure Return - AI and GenAI:
2. Exposure Stability: Inflation
Inflation has been a moderately stable thematic Hivemind exposure over the last 3 years. Half of the companies in our select large cap universe had an inflation exposure change at some point since 2023. Across all companies, negative exposures flipped to positive ~10% of the time, and positive exposures flipped to negative ~3% of the time.
In our experience, vague, challenging to quantify company exposures (like inflation) have more variance over time.
Select Large Cap Exposures - Inflation:
| Ticker | 2023 | 2024 | 2025 | # Changes |
|---|---|---|---|---|
| XOM | 1 | 1 | 1 | Changes: 0 |
| TSLA | -1 | -1 | 1 | Changes: 1 |
| PLTR | 0 | 0 | 1 | Changes: 1 |
| NVDA | -1 | 1 | -1 | Changes: 2 |
| MSFT | 1 | 0 | 1 | Changes: 2 |
| AMZN | 1 | 1 | 1 | Changes: 0 |
| AAPL | -1 | 1 | -1 | Changes: 2 |
| WMT | 1 | 1 | 1 | Changes: 0 |
| HD | 1 | 1 | 1 | Changes: 0 |
| LLY | 1 | 0 | 0 | Changes: 1 |
| JPM | 0 | 0 | 0 | Changes: 0 |
| BA | 1 | 1 | 1 | Changes: 0 |
Exposure Transition Matrices - Inflation:
2023 -> 2024 (counts and row %):
| -2 | -1 | 0 | 1 | 2 | |
|---|---|---|---|---|---|
| -2 | 23 (71.9%) | 9 (28.1%) | 0 (0.0%) | 0 (0.0%) | 0 (0.0%) |
| -1 | 12 (3.2%) | 284 (76.5%) | 39 (10.5%) | 36 (9.7%) | 0 (0.0%) |
| 0 | 0 (0.0%) | 41 (4.6%) | 707 (78.5%) | 153 (17.0%) | 0 (0.0%) |
| 1 | 2 (0.2%) | 36 (2.8%) | 134 (10.5%) | 1108 (86.4%) | 2 (0.2%) |
| 2 | 0 (0.0%) | 0 (0.0%) | 0 (0.0%) | 0 (0.0%) | 0 (0.0%) |
2024 -> 2025 (counts and row %):
| -2 | -1 | 0 | 1 | 2 | |
|---|---|---|---|---|---|
| -2 | 18 (50.0%) | 15 (41.7%) | 2 (5.6%) | 1 (2.8%) | 0 (0.0%) |
| -1 | 7 (2.0%) | 268 (75.5%) | 38 (10.7%) | 42 (11.8%) | 0 (0.0%) |
| 0 | 0 (0.0%) | 44 (5.2%) | 666 (78.4%) | 139 (16.4%) | 0 (0.0%) |
| 1 | 1 (0.1%) | 45 (3.8%) | 124 (10.3%) | 1027 (85.7%) | 2 (0.2%) |
| 2 | 0 (0.0%) | 0 (0.0%) | 0 (0.0%) | 2 (100.0%) | 0 (0.0%) |
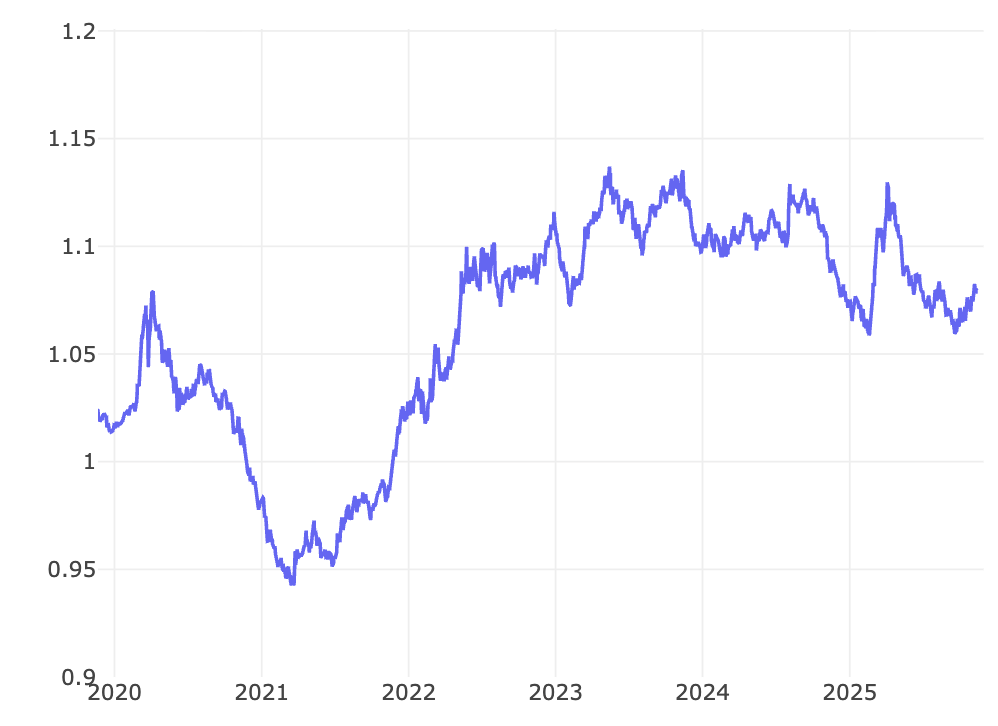
Exposure Return - Inflation:
3. Exposure Stability: US Tariffs
Tariff exposures were fairly stable over the last 3 years. Across all companies, negative exposures flipped to positive <4% of the time. Positive tariff exposures were both rare and unstable.
Select Large Cap Exposures - US Tariffs:
| Ticker | 2023 | 2024 | 2025 | # Changes |
|---|---|---|---|---|
| XOM | 0 | 0 | 0 | Changes: 0 |
| TSLA | 1 | -1 | -1 | Changes: 1 |
| PLTR | 0 | 0 | 0 | Changes: 0 |
| NVDA | -1 | -1 | -1 | Changes: 0 |
| MSFT | -1 | -1 | -1 | Changes: 0 |
| AMZN | -1 | -1 | -1 | Changes: 0 |
| AAPL | -1 | -1 | -1 | Changes: 0 |
| WMT | -2 | -1 | -1 | Changes: 1 |
| HD | -1 | 0 | -1 | Changes: 2 |
| LLY | 0 | -2 | -2 | Changes: 1 |
| JPM | 0 | 0 | 0 | Changes: 0 |
| BA | -1 | -1 | -1 | Changes: 0 |
Exposure Transition Matrices - US Tariffs:
2023 -> 2024 (counts and row %):
| -2 | -1 | 0 | 1 | 2 | |
|---|---|---|---|---|---|
| -2 | 7 (29.2%) | 14 (58.3%) | 3 (12.5%) | 0 (0.0%) | 0 (0.0%) |
| -1 | 14 (2.1%) | 498 (74.3%) | 145 (21.6%) | 13 (1.9%) | 0 (0.0%) |
| 0 | 3 (0.2%) | 133 (7.2%) | 1683 (91.5%) | 20 (1.1%) | 0 (0.0%) |
| 1 | 0 (0.0%) | 13 (25.0%) | 10 (19.2%) | 29 (55.8%) | 0 (0.0%) |
| 2 | 0 (0.0%) | 0 (0.0%) | 0 (0.0%) | 0 (0.0%) | 0 (0.0%) |
Transition matrix 2024 -> 2025 (counts and row %):
| -2 | -1 | 0 | 1 | 2 | |
|---|---|---|---|---|---|
| -2 | 7 (30.4%) | 15 (65.2%) | 1 (4.3%) | 0 (0.0%) | 0 (0.0%) |
| -1 | 17 (2.8%) | 447 (74.9%) | 114 (19.1%) | 19 (3.2%) | 0 (0.0%) |
| 0 | 1 (0.1%) | 150 (8.5%) | 1599 (90.7%) | 12 (0.7%) | 0 (0.0%) |
| 1 | 0 (0.0%) | 16 (27.6%) | 16 (27.6%) | 26 (44.8%) | 0 (0.0%) |
| 2 | 0 (0.0%) | 0 (0.0%) | 0 (0.0%) | 0 (0.0%) | 0 (0.0%) |
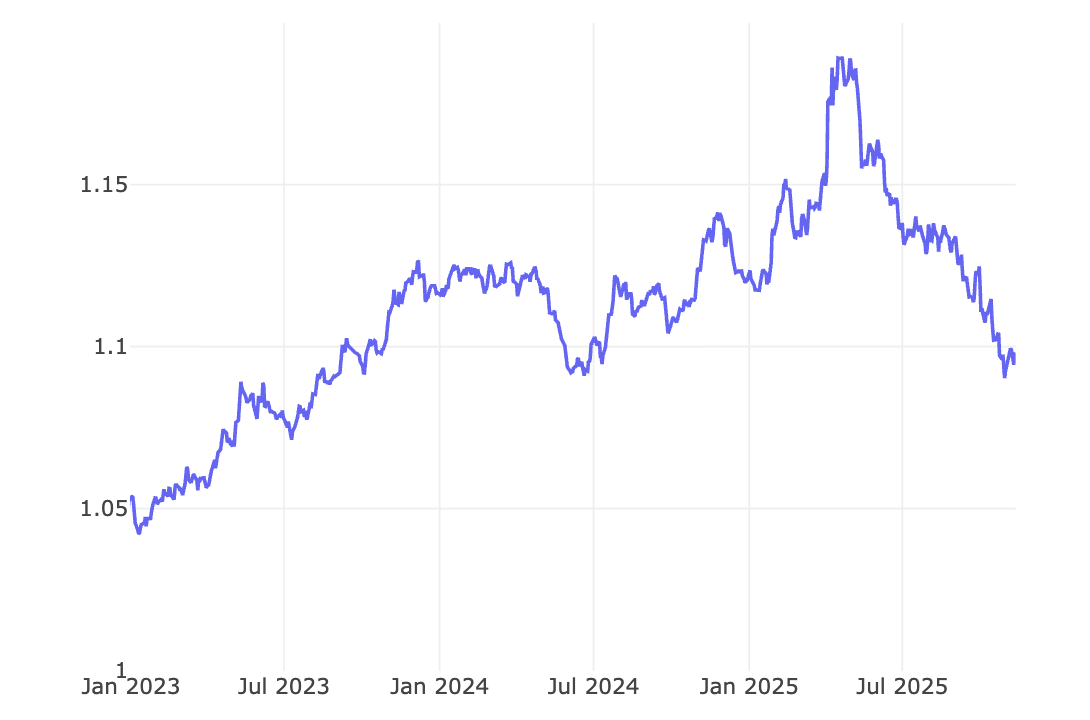
Exposure Return - US Tariffs:
4. Takeaways
- Clearly defined exposures are fairly stable throughout time
- More ambiguous or hard-to-quantify exposures are less stable, but not necessarily less valuable
- Certain thematic exposures (like tariffs) show both stability and specific quirks
- Exposure drift is partially explained by changes in company operations and disclosures
To learn more about Hivemind, or to schedule a demo, email us at hi@ forecastos.com