Hivemind Factors Explain Incremental Out-of-Sample Variance

Table of Contents
- Why 2025 Has Been Challenging For Quantitative PMs
- Creating Macro and Subindustry Hivemind Factors
- How We Measured Out-of-Sample Explained Variance (R²)
- Results: Hivemind Factors Explain Incremental Out-of-Sample Variance
- Email Us: [email protected]
1. Why 2025 Has Been Challenging For Quantitative PMs
If you ran a large book through 2025’s volatility, you probably spent more time on the phone than in the market.
“Are you down? We’re off 3%.”
Most of those calls were really a fishing expedition for: "what exposure did I miss?" and "does everyone have it, or just me?" The uncomfortable truth is that, outside of a handful of slow-moving market, industry, and style boxes, few managers could answer that question with conviction.
The challenging 2025 market environment has been quantifiable; it has been measurably harder to isolate alpha. Out-of-sample variance explained by market, industry / subindustry, and common style factors dropped by roughly a third vs previous benchmarks. Even sophisticated hedge funds like Citadel and Millennium have had lackluster years to date.
What could be causing this?
We believe the challenging 2025 investment environment was caused in part by growth in emergent macro factors and nascent subindustries. We outline and test this hypothesis below.
2. Creating Macro and Subindustry Hivemind Factors
To better explain variance
We believe out-of-sample explained variance declined in 2025 (in part) due to an increase in A) emergent macro factors and B) nascent subindustries not captured well by traditional factors.
A) Emergent Macro Factors
A quick look at the ForecastOS Hivemind UI gives us some ideas what macro factor exposures might be to blame:
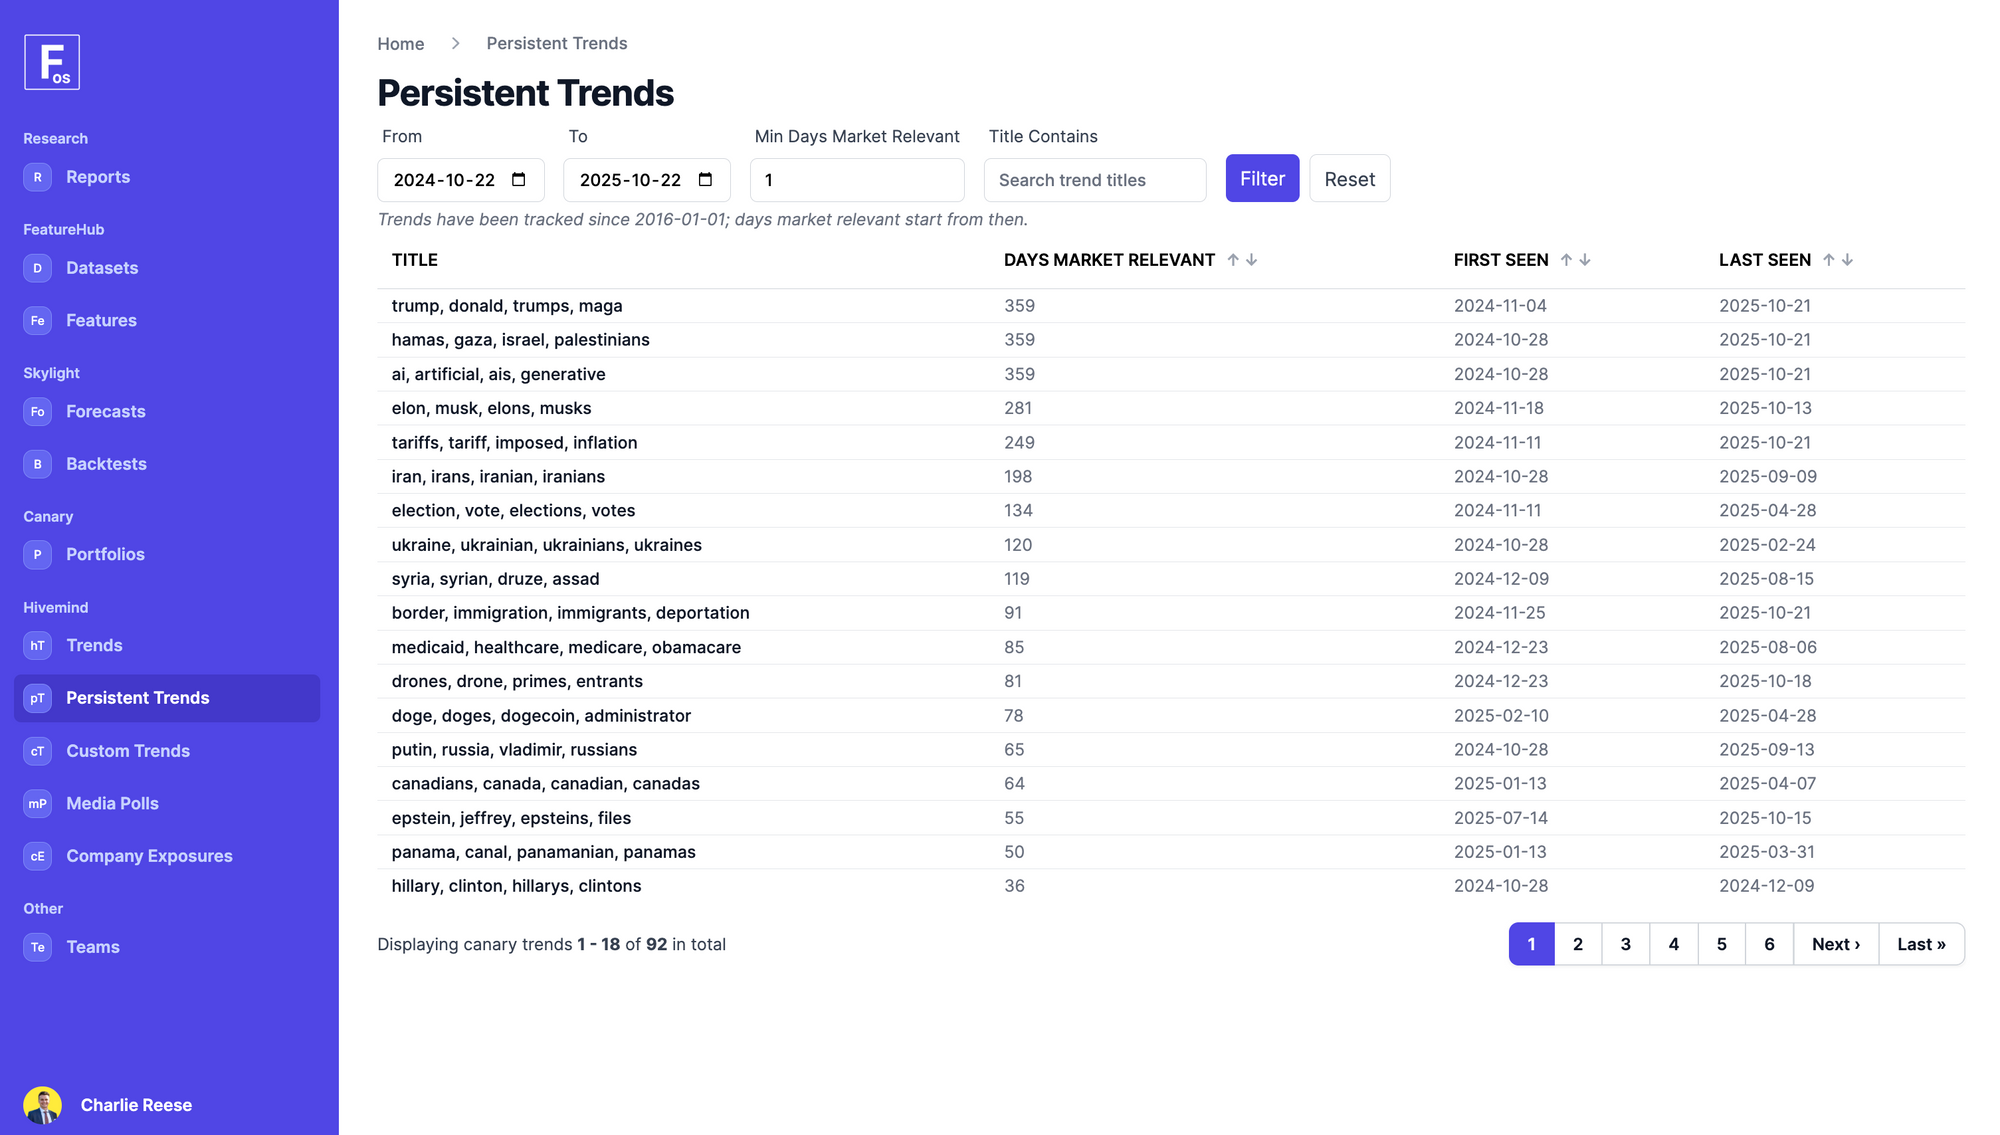
Given the above, and what we learned from our most recent article Measuring Emergent Sources of Risk & Return Since 2020, we'll use the following Hivemind stock-specific macro exposures to better capture volatility:
- AI / generative AI
- Defense and national security spending
- Green energy
- Tariffs
- Medicaid cuts
- Inflation
Select large cap Hivemind macro exposures:
| Ticker | AI / genAI | Defense and sec. | Green energy | Tariffs | Medicaid cuts | Inflation |
|---|---|---|---|---|---|---|
| XOM | 0 | 0 | (2) | 0 | 0 | 2 |
| TSLA | 1 | 0 | 2 | (1) | 0 | 1 |
| PLTR | 1 | 1 | 0 | 0 | 1 | 1 |
| NVDA | 2 | 1 | 1 | (1) | 0 | (1) |
| MSFT | 2 | 1 | 0 | 0 | 0 | 0 |
| AMZN | 1 | 1 | 1 | (1) | 0 | 1 |
| AAPL | 1 | 0 | 0 | (1) | 0 | (1) |
| WMT | 0 | 0 | 0 | (2) | 0 | 2 |
| HD | 0 | 0 | 0 | (1) | 0 | 1 |
| LLY | 0 | 0 | 0 | 0 | 0 | 2 |
| JPM | 0 | 0 | 0 | 0 | 0 | 0 |
| BA | 0 | 2 | 0 | (1) | 0 | (1) |
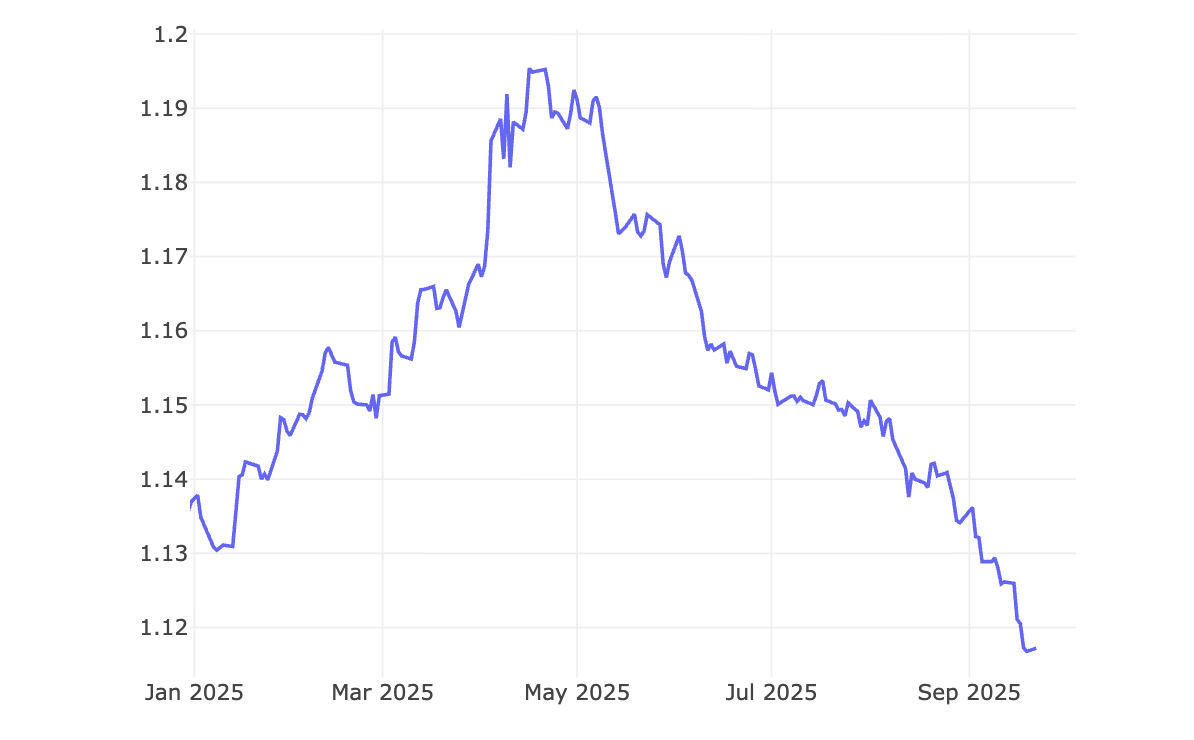
Tariff exposure return (2025):
B) Identifying Nascent Subindustries
For nascent subindustries, we can create a Hivemind pipeline to describe each company in a custom, standardized way.
We can then feed this Hivemind standardized output into an unsupervised learning algorithm to systematically identify groups of similar companies. Doing so at our preferred level of specificity, we identify 292 nascent subindustries across several thousand US listed companies.
If a company does it, we've identified it, and our process is resilient to new / changing businesses going forward!
Select large cap Hivemind nascent subindustries:
| Ticker | Hivemind subindustry centroid vector label |
|---|---|
| XOM | Refined, petroleum, fuels, crude |
| TSLA | Vehicles, electric, rvs, recreational |
| PLTR | Based, software, data, legal |
| NVDA | Chips, processing, memory, solutions |
| MSFT | Client, global, financing, support |
| AMZN | Services, accessories, apparel, retail |
| AAPL | Accessories, streaming, services, digital |
| WMT | Groceries, distribution, pharmacy, products |
| HD | Home, services, furniture, design |
| LLY | Cardiovascular, kidney, disease, metabolic |
| JPM | Investment, consulting, prime, wealth |
| BA | Aircraft, maintenance, pilot, repair |
3. How We Measured Out-of-Sample Explained Variance (R²)
Using our aforementioned 6 Hivemind macro factors and our 292 new Hivemind subindustries, we can measure incremental out-of-sample explained variance.
Benchmark: The Traditional Factors We Used
To perform our analysis, we used the following traditional factors: a market factor (1 for all companies; our intercept), industry (12) and subindustry (32) factors from a major data vendor (one-hot encoded), and style factors.
To calculate our QVM (quality, value, momentum) and size style factors, we used the below ForecastOS feature engineering config:
feature_normalization:
  winsorize:
    - 0.05
    - 0.95
    - - datetime
  standardize:
    - datetime

feature_adjustments_post_normalization:
  shift:
    - 20 # Avoid lookahead
    - - id
      - datetime
    - id
  zero_fill: []

features:
  # Quality: margin
  gross_income_margin_ltm:
    uuid: 49c61109-c029-4c4d-85c9-b1f33a72ea50
  ebit_margin:
    uuid: 47d7d1b0-46cc-4620-b0d3-35aa33fe490a
  net_income_margin_ltm:
    uuid: 7f1e058f-46b6-406f-81a1-d8a5b81371a2

# ...
# Email us for full ~200 line config
Note that we only use style_quality, style_value, style_momentum, and style_size in our regression; other factors listed above are simply inputs to the above composite QVM style factors.
Our Regression
Our regression was cross-sectional for the top 1000, 2000, and 3000 US stocks by market cap, fitting a separate model for each 20-trading-day return period. To control instability from correlated or thinly-supported factors, we applied ridge regularization. The shrinkage penalty tempered extreme coefficients, ensuring that each exposure competed for explanatory power without overfitting to noise.
Further, to prevent wild coefficients for the 292 emerging sub-industry factors, we capped their effective influence through both ridge shrinkage and scaled exposure weighting. In practice, this meant thin sub-industries were allowed to express signal - but only in proportion to the data depth supporting them, keeping the regression stable.
For each date, we split the universe into two disjoint sets: one for training (75%), where coefficients were estimated, and another for testing (25%), where regression performance (i.e. explained variance or R²) was measured. This intra-period separation helped assess generalization i.e. whether the fitted relationships held beyond the specific sample used for estimation.
4. Results: Hivemind Factors Explain Incremental Out-of-Sample Variance
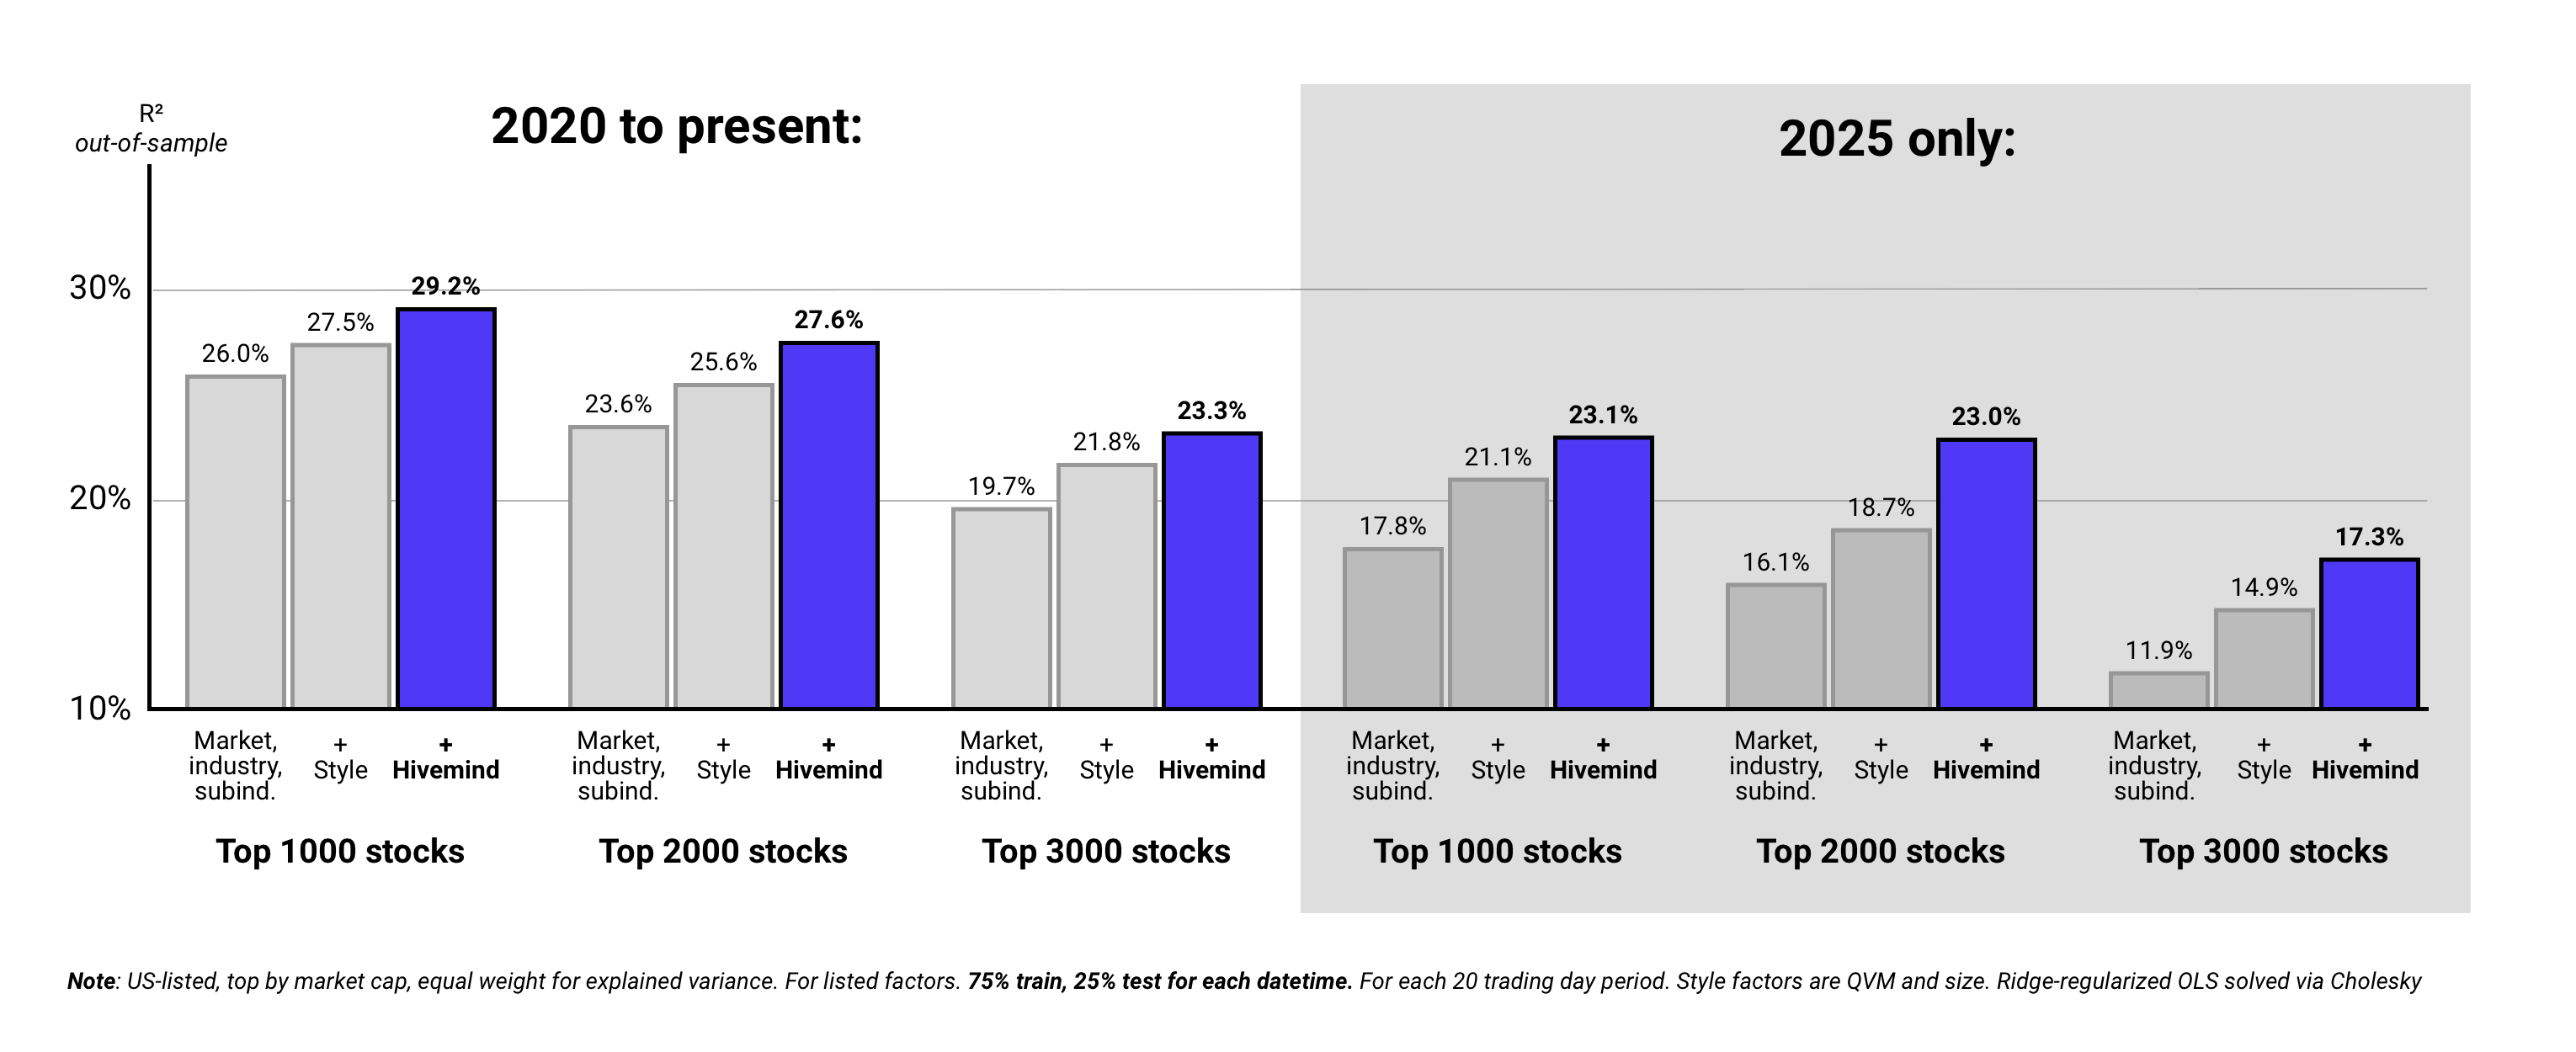
As per above, Hivemind’s macro and subindustry factors incrementally improved out-of-sample explained variance meaningfully; they identified systematic risk that conventional factors missed.
Perhaps unsurprisingly given dynamic macro and market narratives as of late, the improvement was stronger in 2025 than in prior years - roughly double.
5. Email us: [email protected]
If you’re finding volatility harder to manage and alpha harder to locate, we'd love to compare notes!
In today’s fast-moving investment landscape, where generative AI, inflation fluctuations, geopolitical upheavals, and global trade shifts increasingly dictate market behaviour, static risk models fall short. Only tools rooted in perceived causality, not outdated correlations, can help institutional investors quickly and accurately surface and manage dynamic exposures.
That’s exactly what ForecastOS Hivemind delivers. By converting unstructured data - podcasts, filings, and other live feeds - into clean, point‑in‑time factor signals, Hivemind equips you with real-time insights for emergent themes.
ForecastOS Hivemind isn’t just a tool - it’s your edge. In an era where the pace and complexity of market forces are escalating, Hivemind empowers you not just to respond, but to anticipate and act with conviction.
Let’s partner to help you discover, measure, and manage emergent sources of alpha and risk!
To learn more about Hivemind, or to schedule a demo, email us at hi@ forecastos.com